

Features
Visualizer
See your memory graph, and watch your agents read and write it live
The Visualizer draws your whole memory graph — every node, edge and hyperedge — and animates what your agents do with it as they work. Open it from Visualizer in the dashboard.
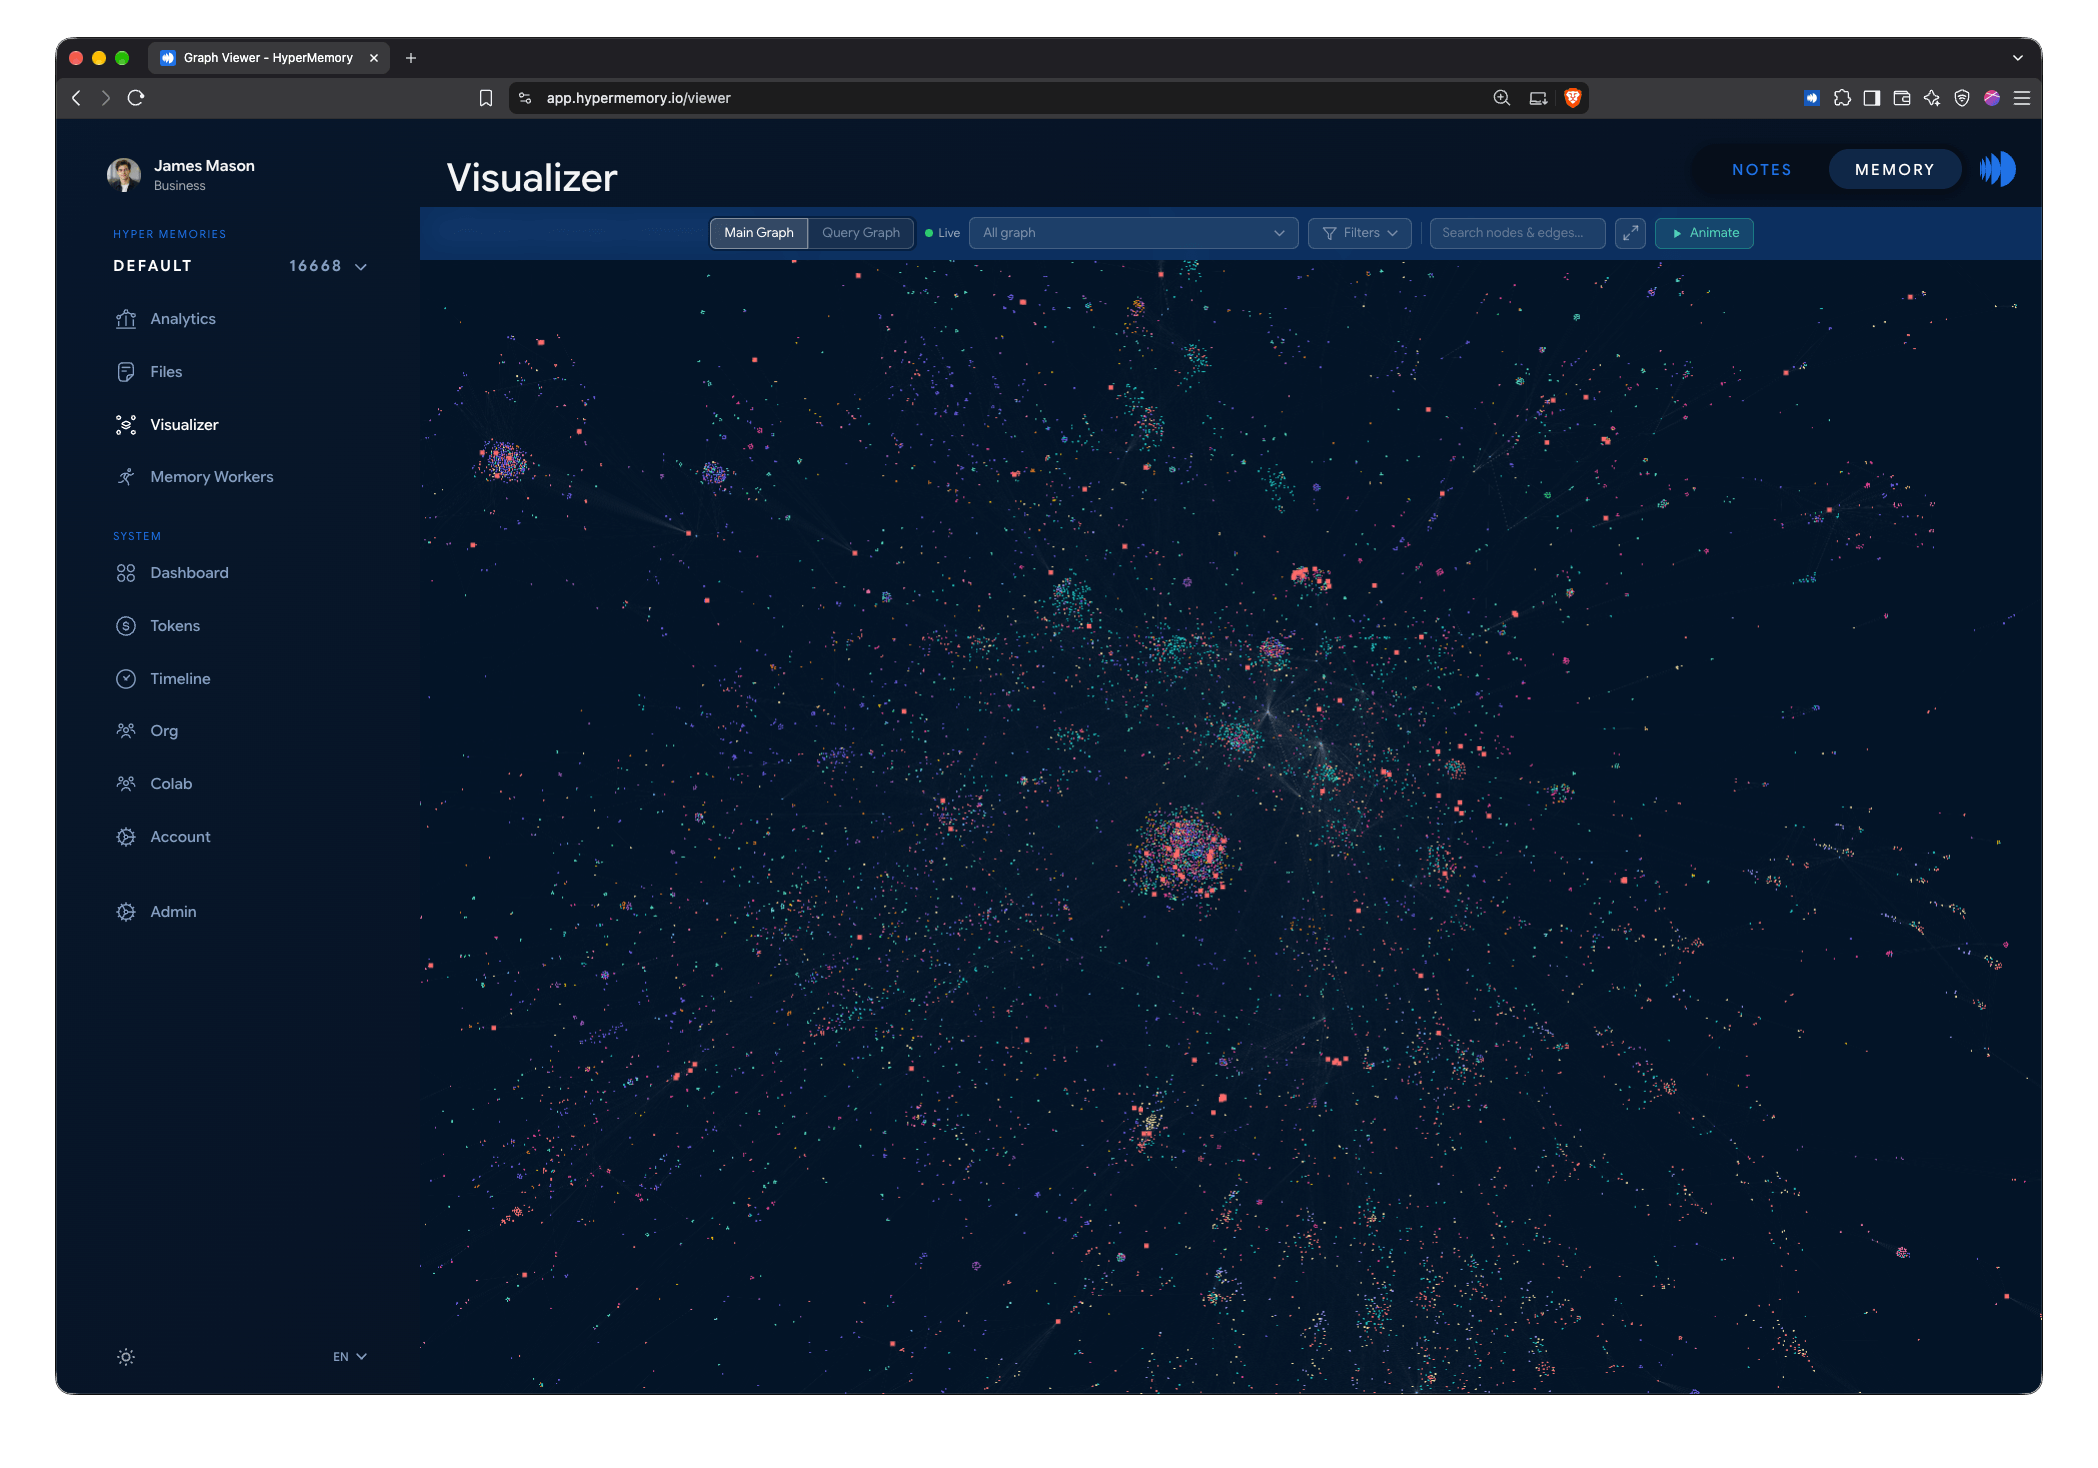
The Visualizer showing a whole memory graph. Each dot is a node; clusters are closely connected memories.
Two modes
The switch at the top of the Visualizer chooses what you see:
| Mode | Shows |
|---|---|
| Main Graph | Your whole memory graph — or one hyperedge of it — with your agents’ reads and writes animated as they happen. |
| Query Graph | Only what each recall finds: the nodes and edges that answered the query. |
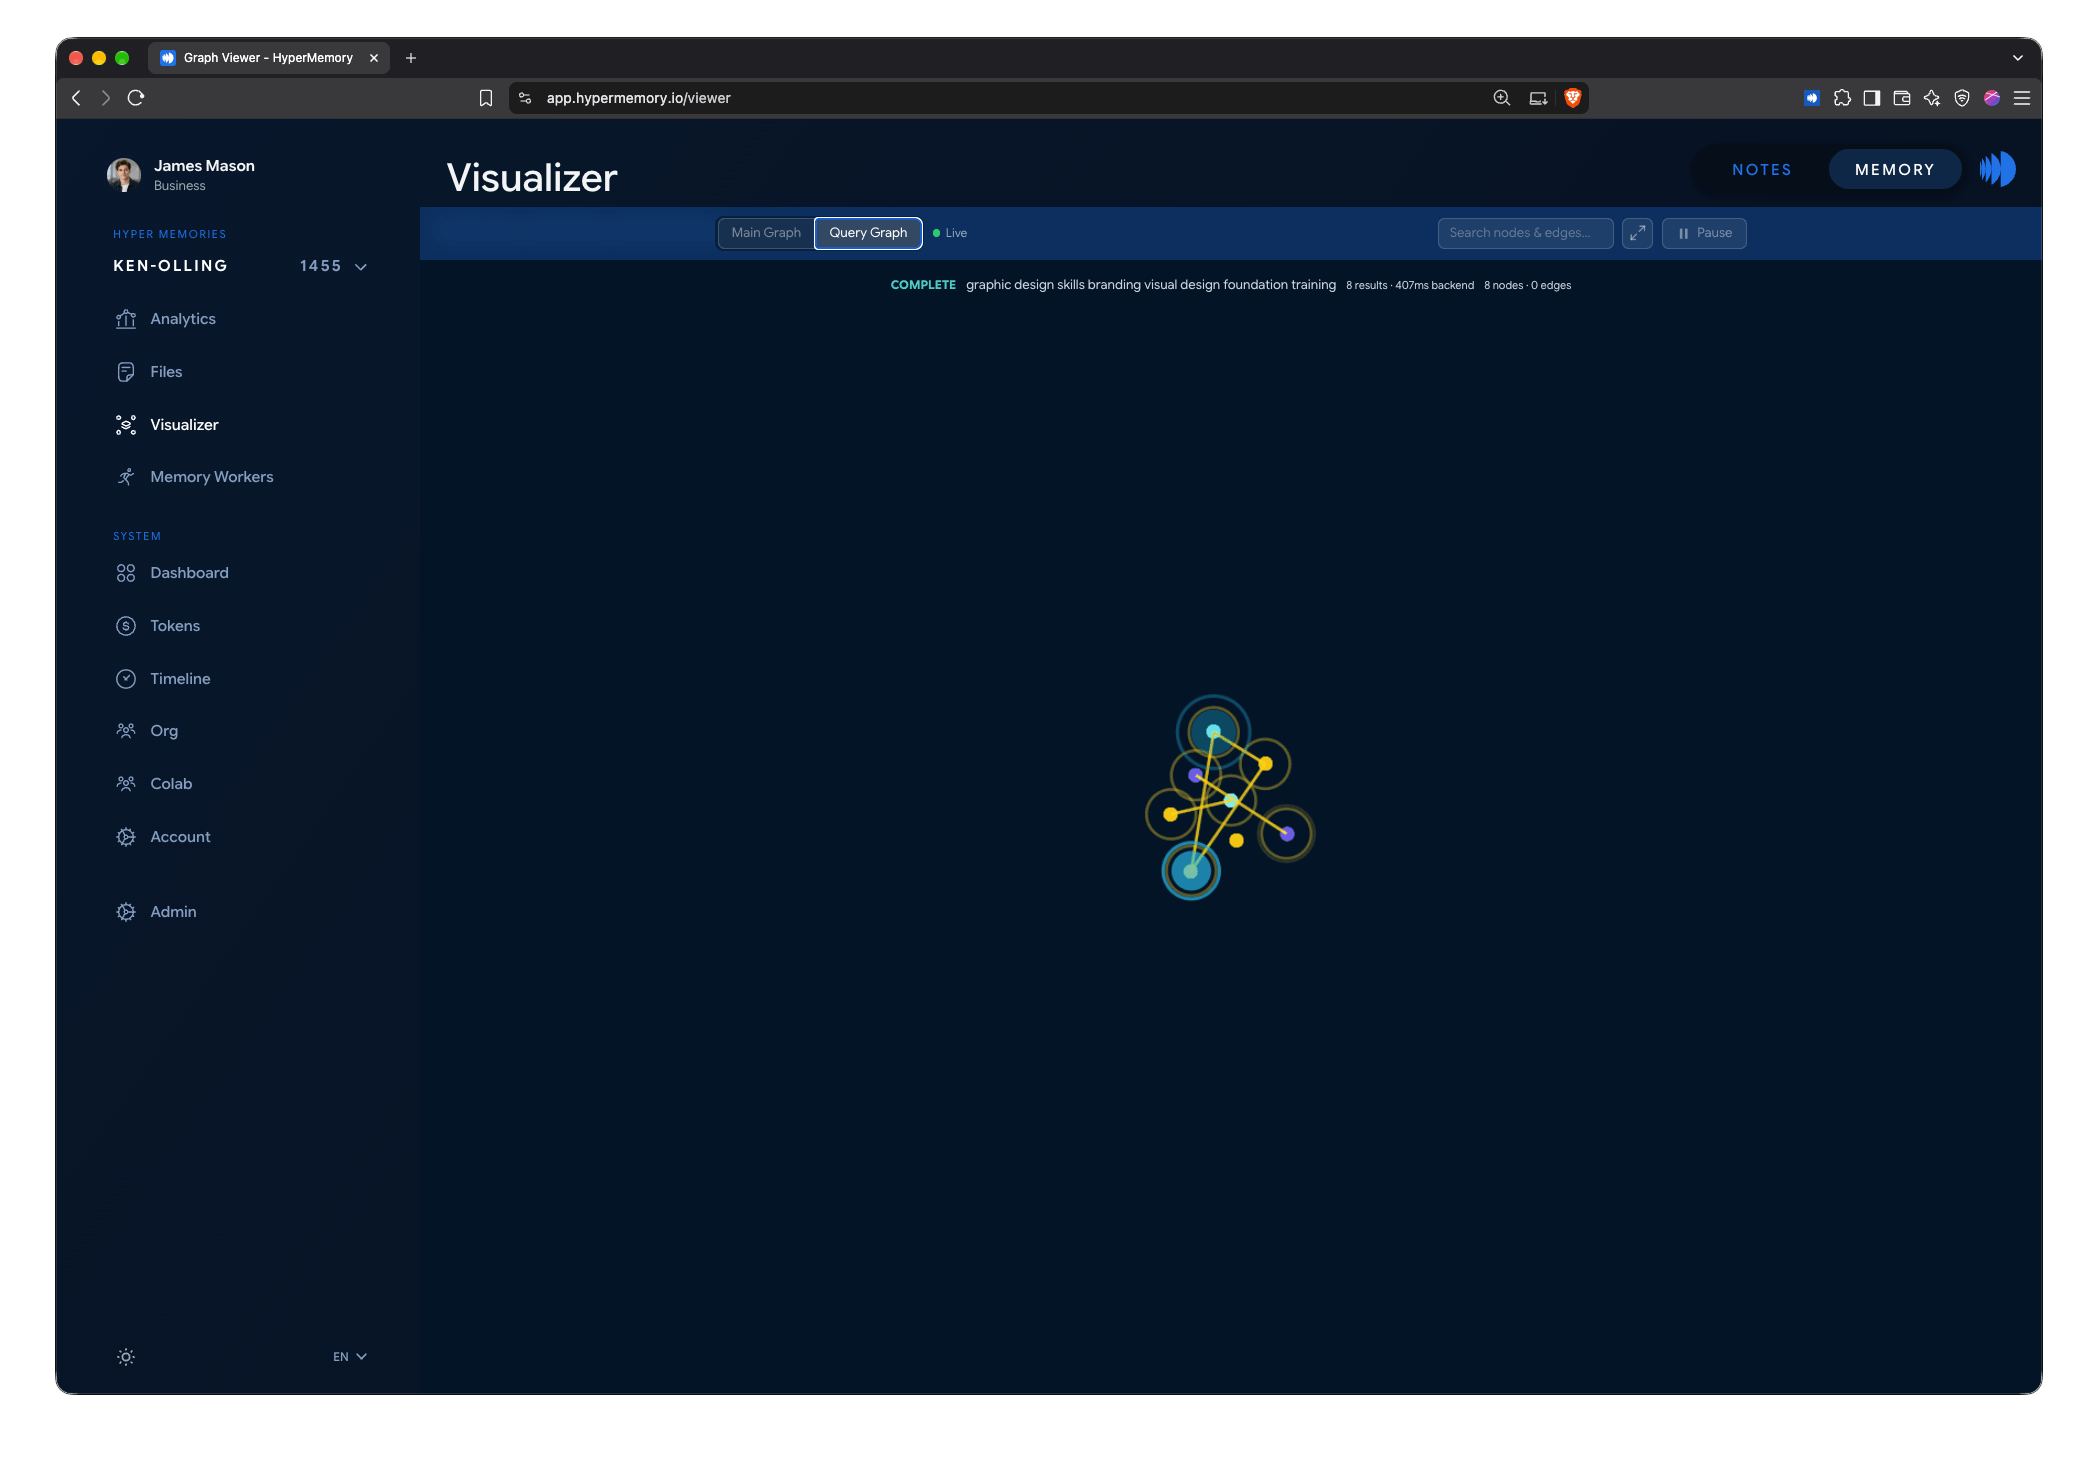
Query Graph: the query, its status, the number of results, how long the search took, and the nodes and edges it returned.
In Query Graph, the bar above the graph shows each query as it runs — waiting, running, complete or failed — with the query text, the number of results, the search time, and how many nodes and edges came back.
The toolbar
| Control | What it does |
|---|---|
| Live | The connection to your graph. Live means changes appear as they happen; it also shows connecting or reconnecting. |
| All graph | Show the whole graph, or pick one hyperedge — a project, a release, a conversation — to focus on its members. |
| Filters | Show or hide nodes, documents and orphans, and limit the view to the last hour, the last 24 hours or all time. |
| Search nodes & edges | Find a node or relationship by name or text. |
| Fit to screen | Zoom so the whole graph fits. |
| Animate / Pause | Start or stop the layout’s movement. |
| Layout (Query Graph) | Tune the layout: repulsion, gravity, link distance, node size, edge width and more. |
Large graphs show the most important items first; search to find the rest.
Watching your agents work
With Live on, the Visualizer animates every read and write your agents make.
Reads
When an agent recalls memories, the nodes and edges it reads light up in yellow, so you can see exactly what context it pulled in.
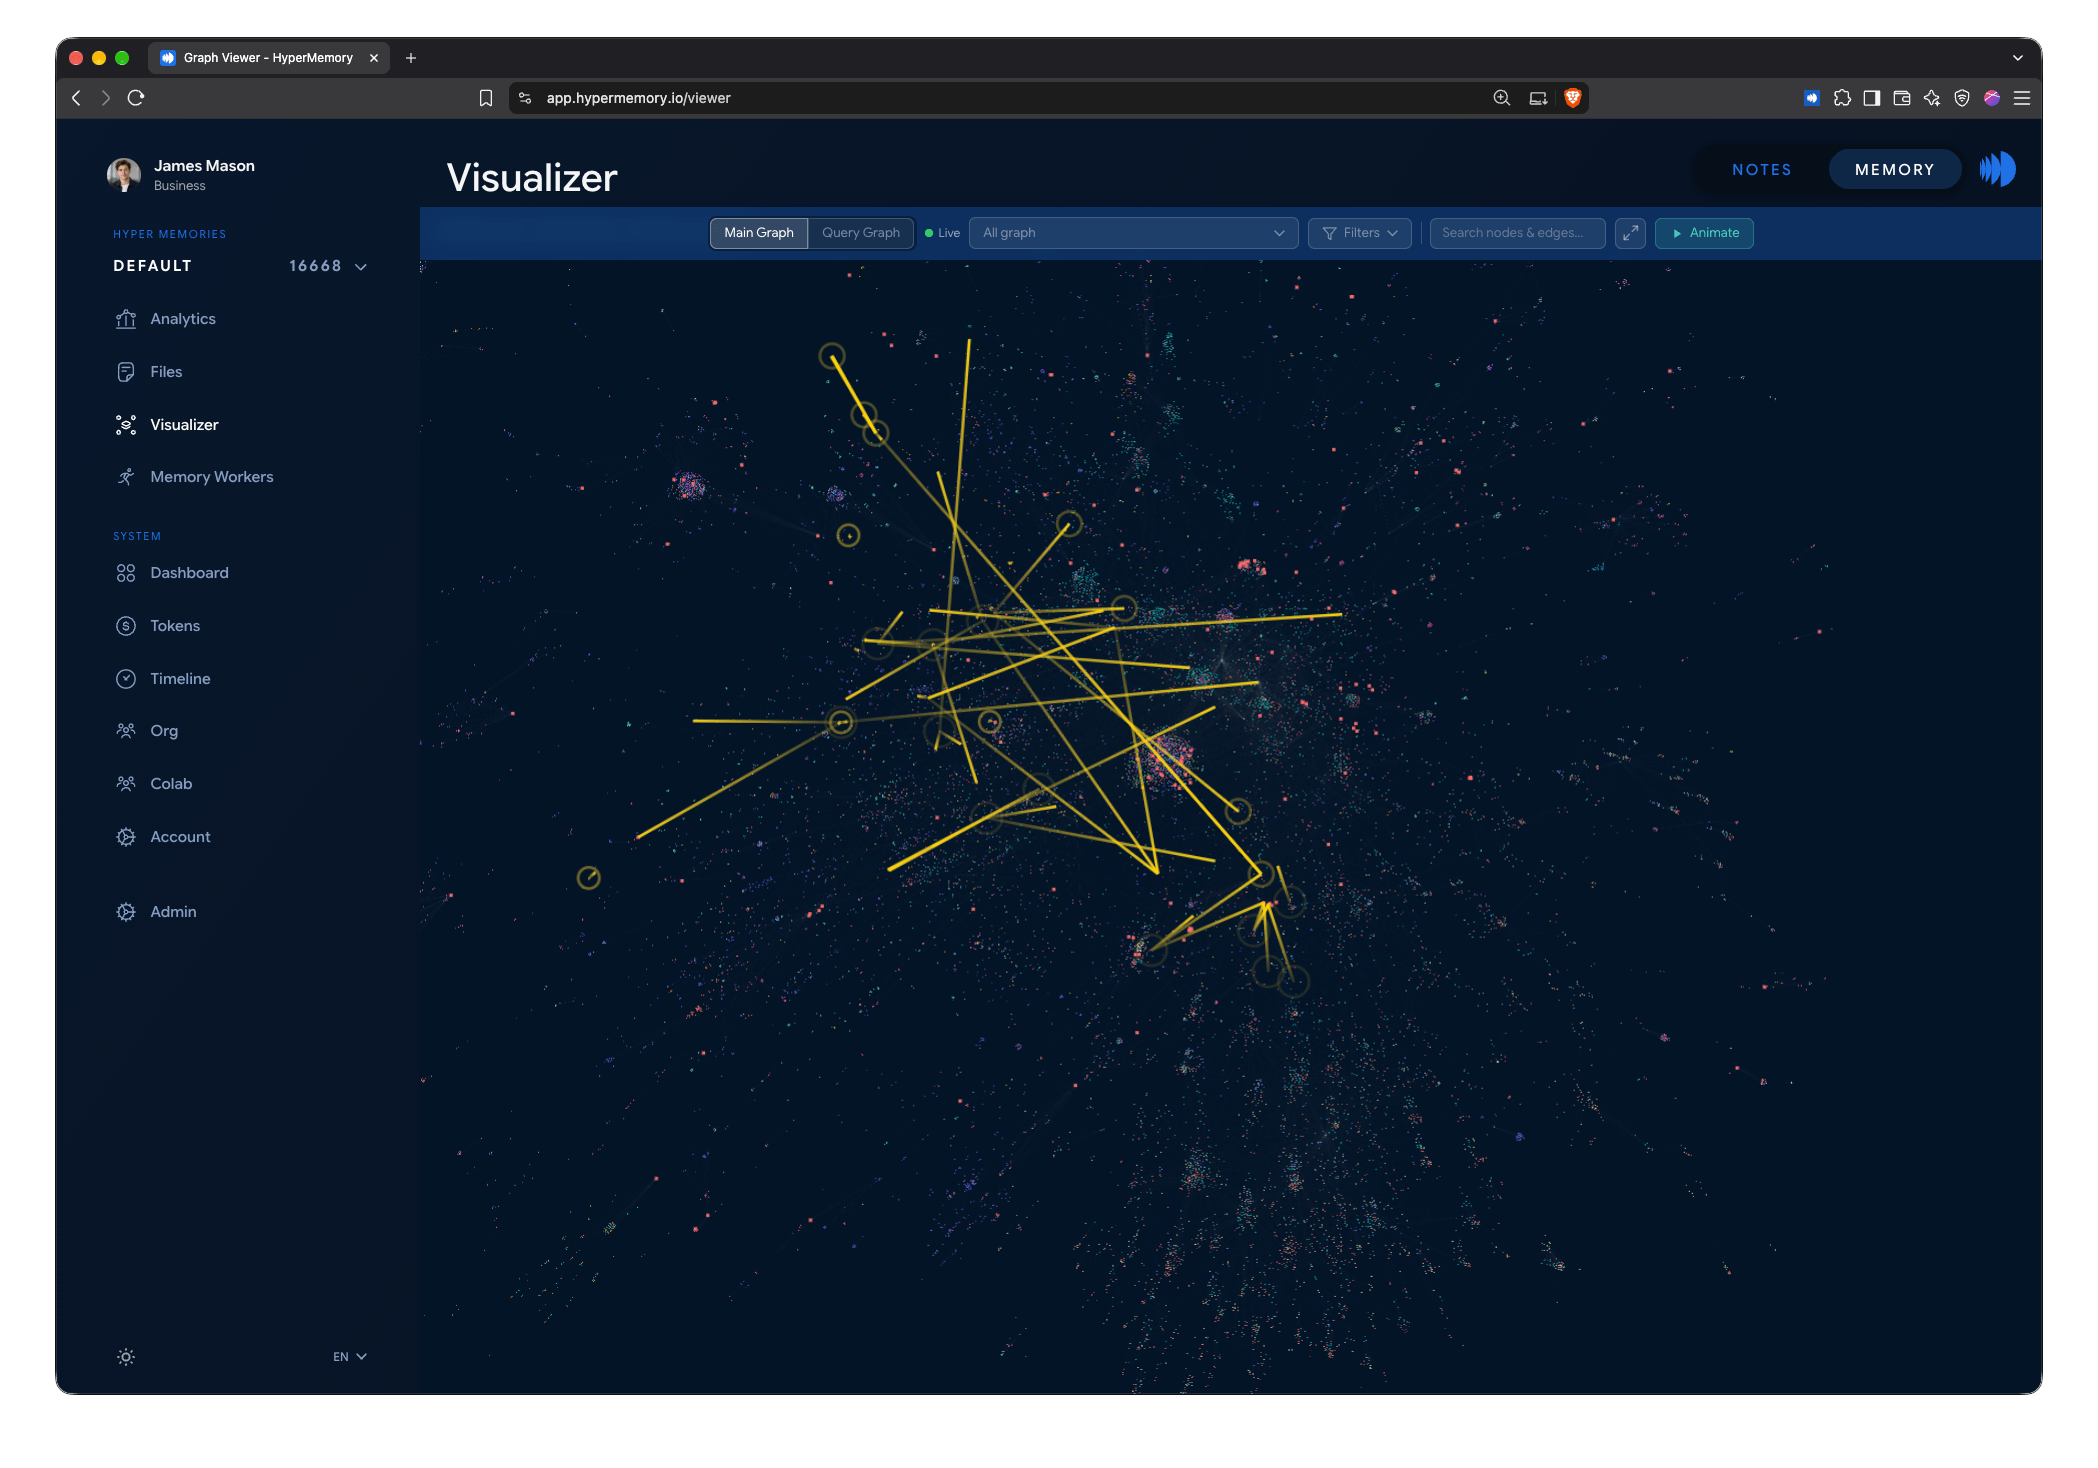
An agent’s recall: the nodes and edges it read light up in yellow.
Writes
When an agent stores or updates a memory, the change flashes in green: a ring around each node created or updated, and a line for each edge created or updated.
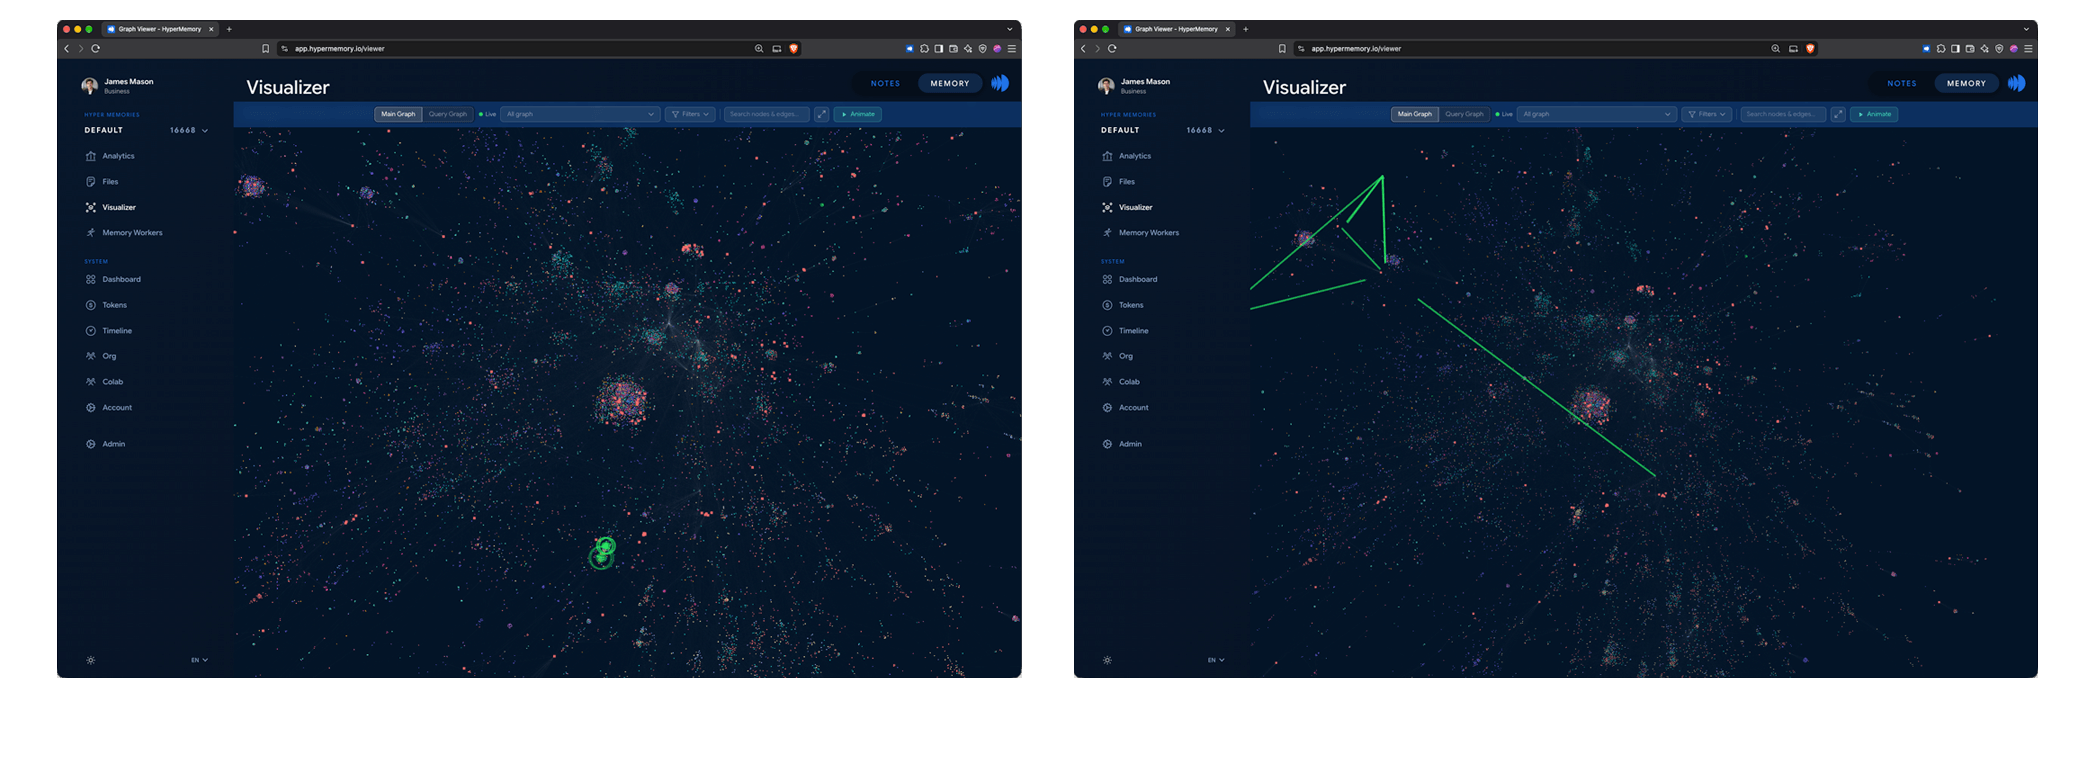
Writes: new and updated nodes (left) and new and updated edges (right) appear in green.
Select a node to see its connections
Click a node and every edge connected to it is drawn out to its neighbours. The sidebar lists the node’s details and all its relationships.
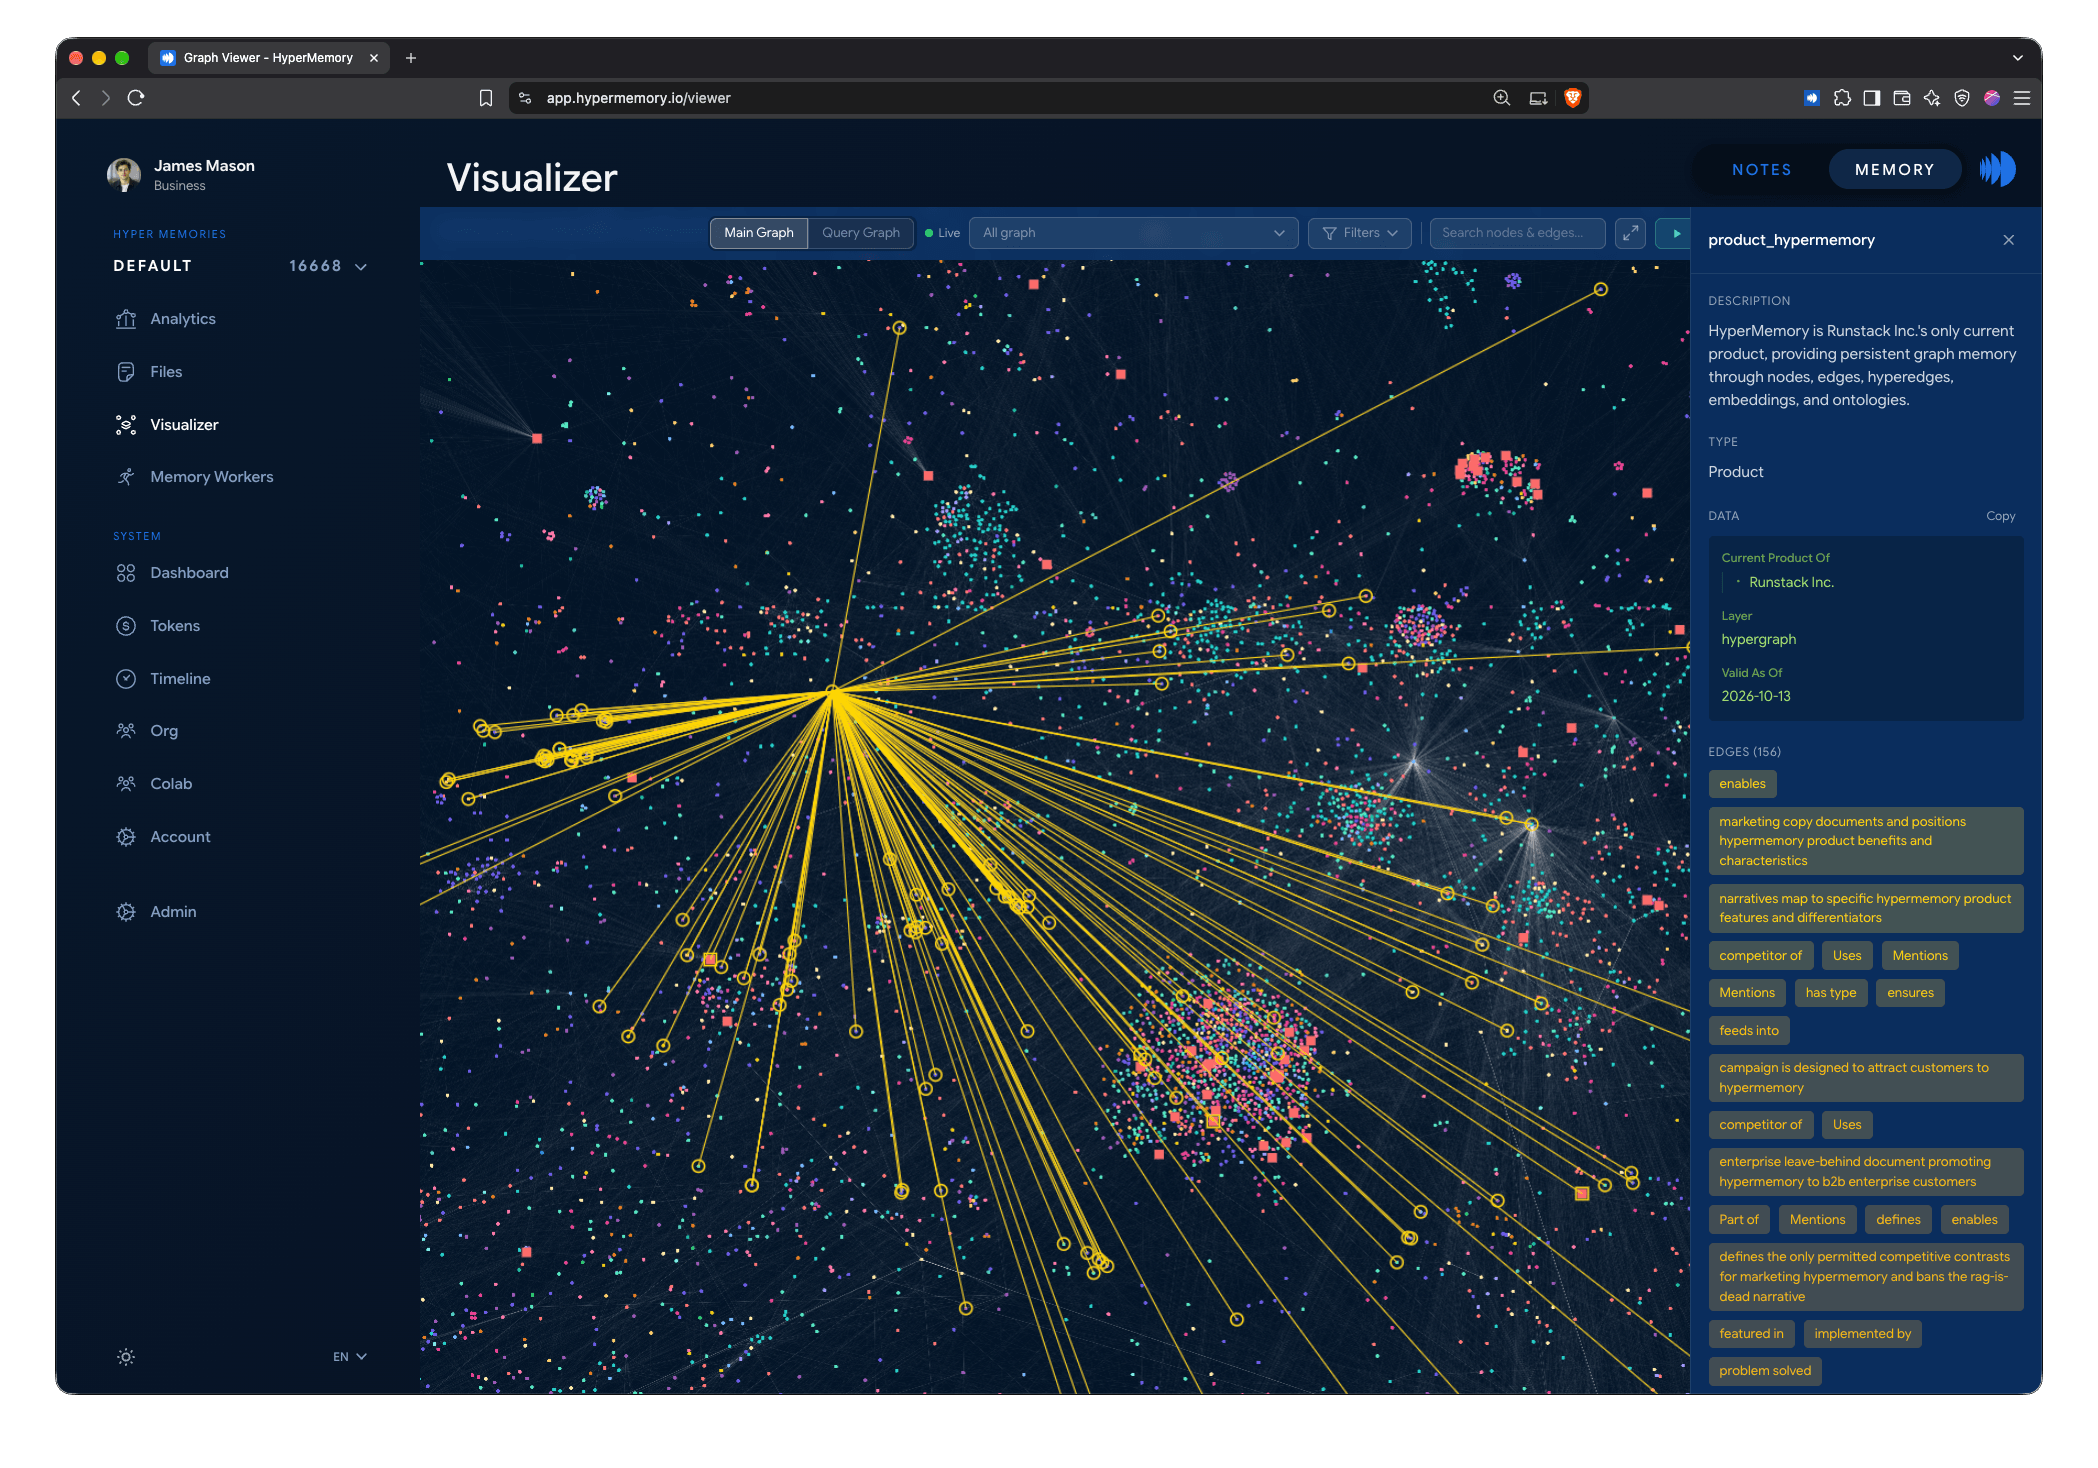
A selected node with all of its edges drawn out, and its relationships listed in the sidebar.
Reading the sidebar
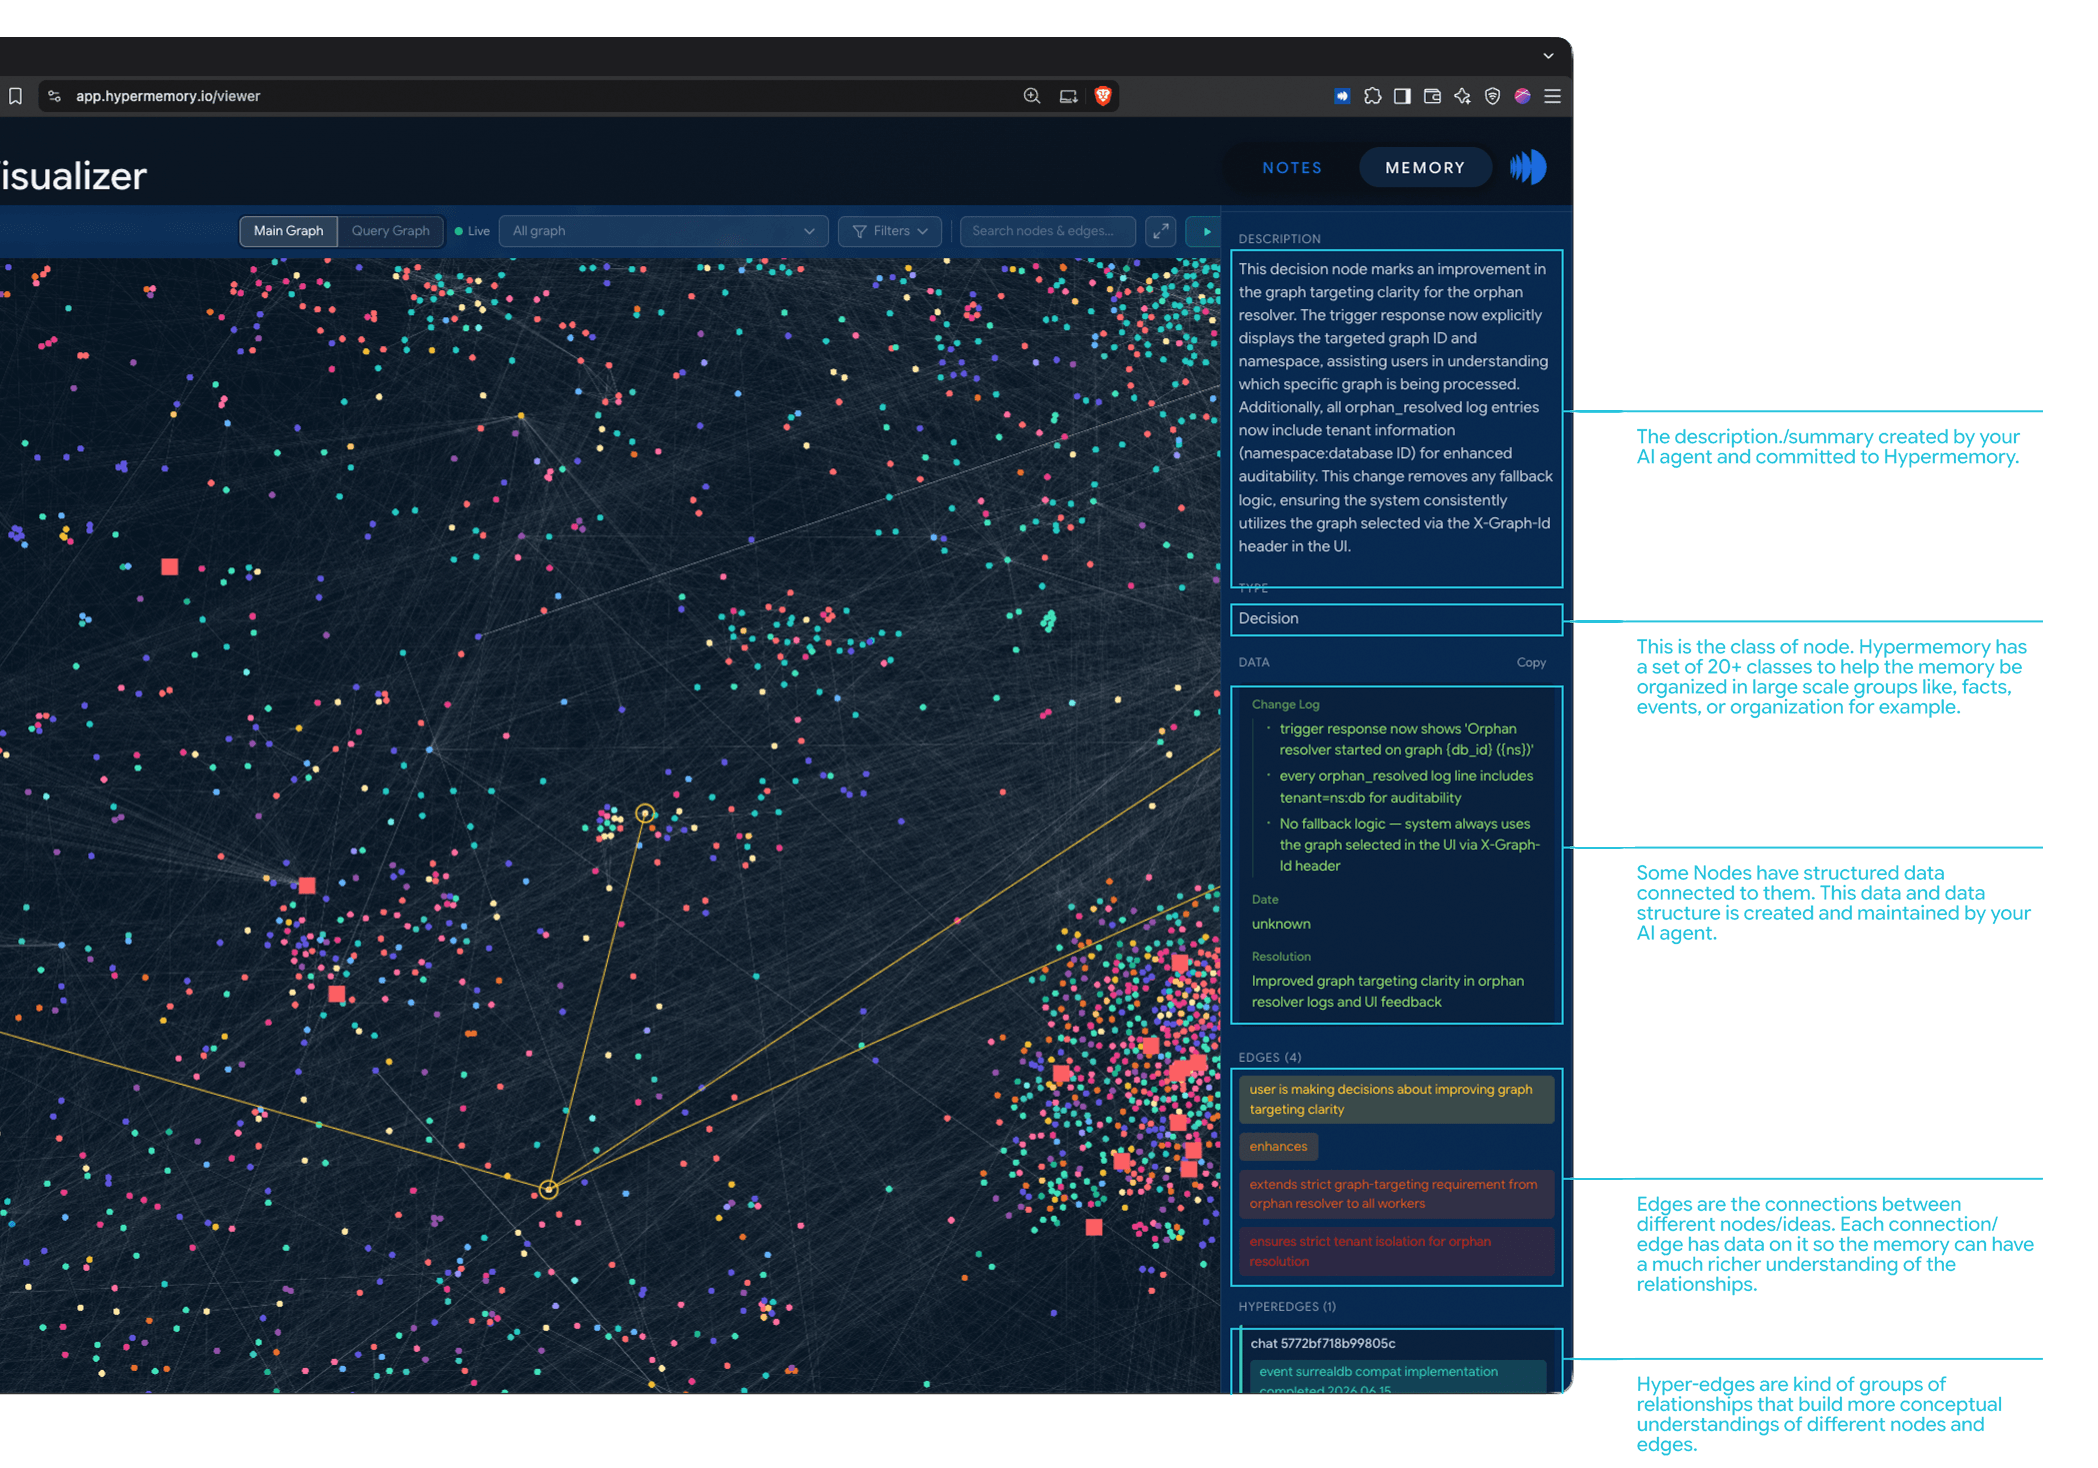
The sidebar for a selected node.
| Section | What it shows |
|---|---|
| Description | The summary your AI agent wrote and stored in HyperMemory. |
| Type | The node’s class — one of HyperMemory’s 20+ node types, such as Decision, Fact, Event or Organization — which groups memory at large scale. |
| Data | Structured data your agent created and maintains for the node: dates, statuses, change logs, IDs. Copy copies it as JSON. |
| Edges | The node’s connections to other nodes. Each edge carries its own wording and data, so the memory understands how things relate. |
| Hyperedges | Groups of relationships that tie several nodes into one bigger idea — a project, a release, a conversation. |
Click an edge or hyperedge to see its relationship, its connected nodes or members, and when it was created and updated. Nodes that came from an uploaded file show their Sources — the pages and sections they were extracted from.